Plan9/Debugging with Acid
Random notes on how to debug Plan9 programs using acid…
Overview
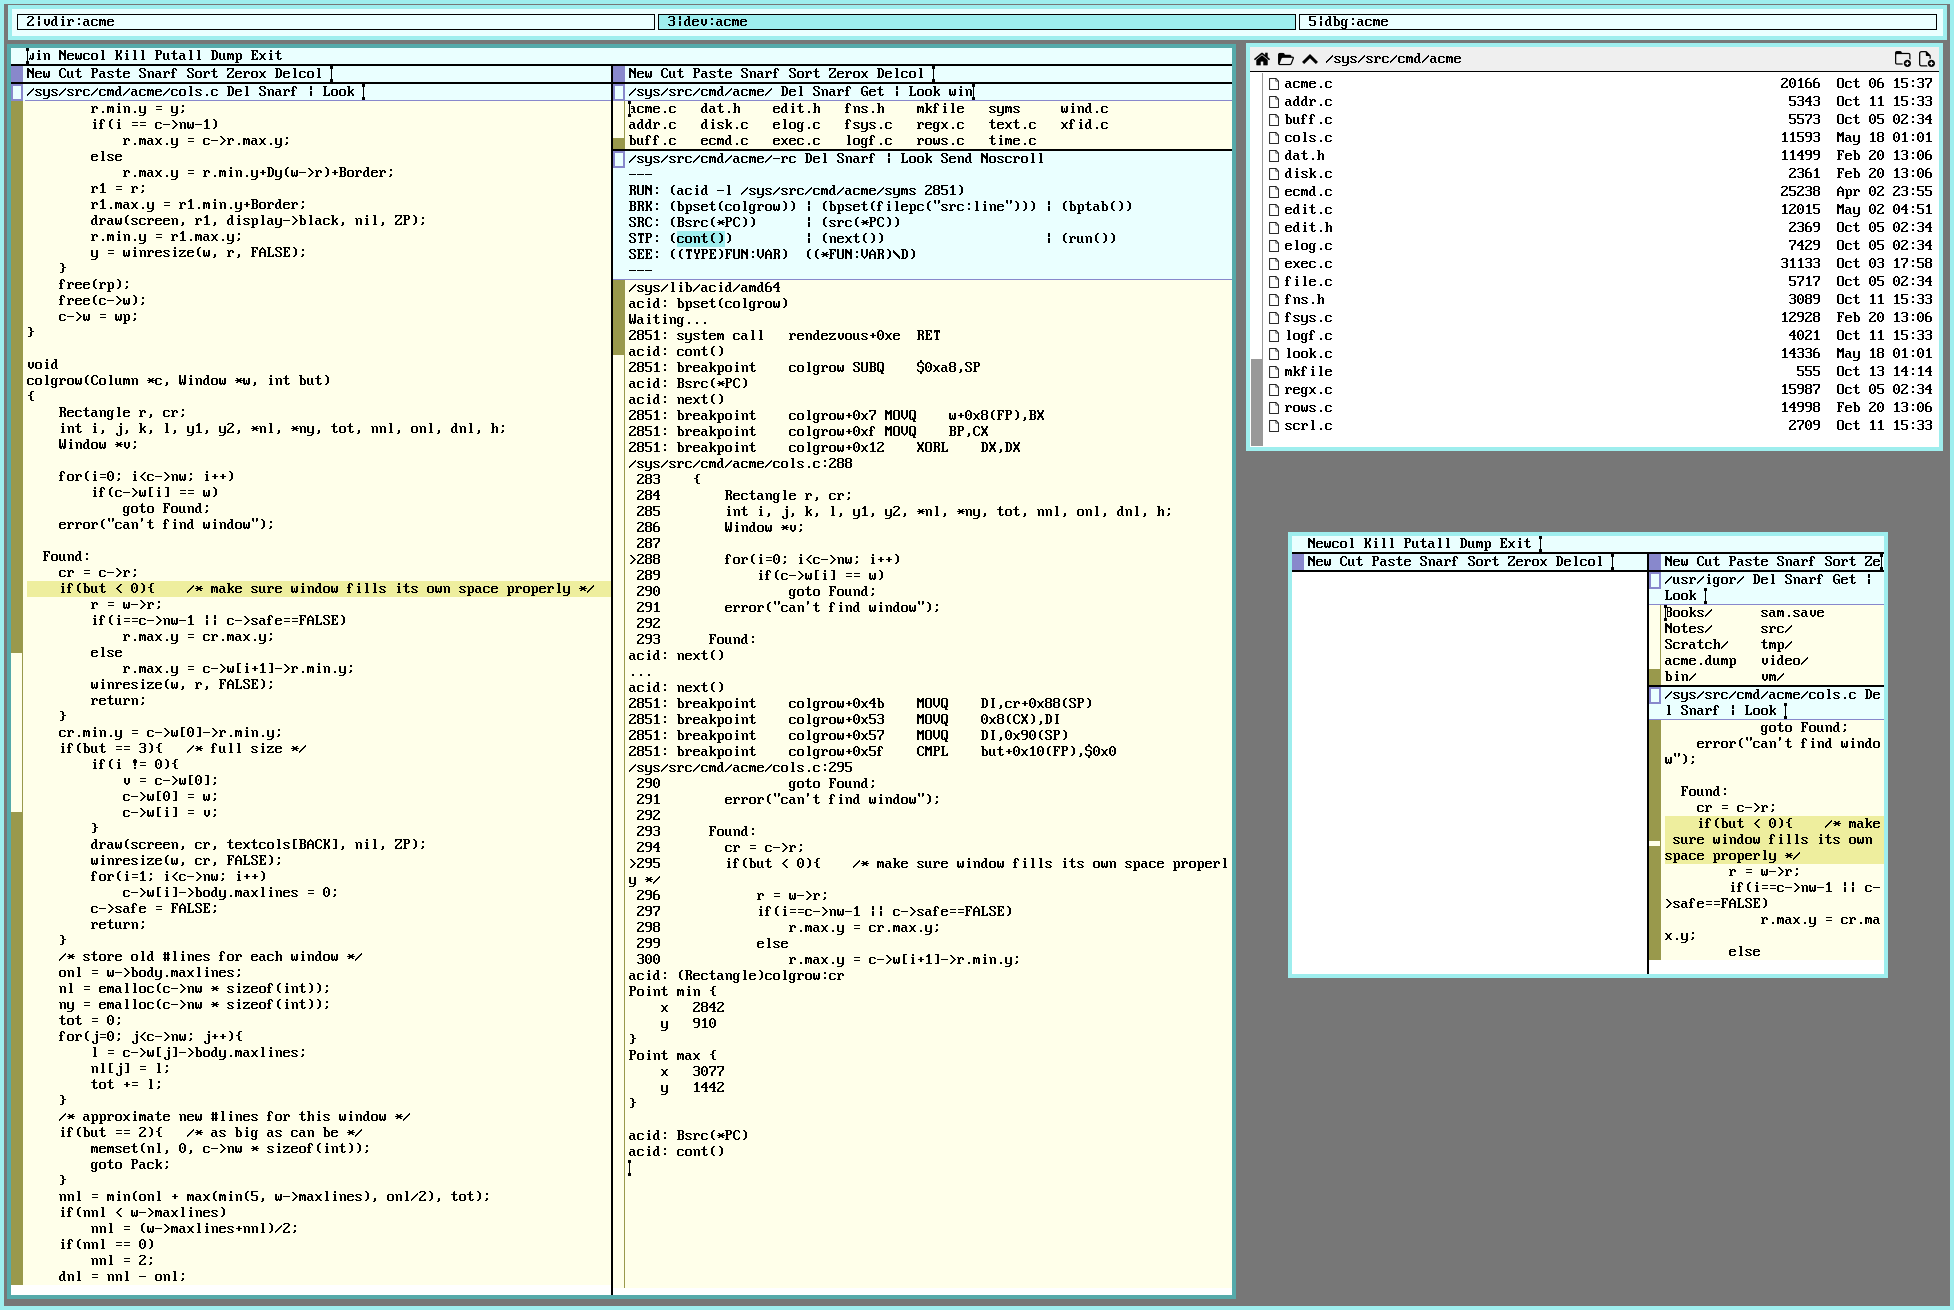
There is a rendering glitch in acme. Click on the image above to see a larger version and take a look at the bottom part of the large acme window (can you spot it?)…
After some random trawling through the code it seems like the
acme function
/sys/src/cmd/acme/cols.c:/^colgrow might be responsible for the
glitch. The function is a bit too complex to digest by simply reading
the code so we are going to use acid to
debug it, and hope to find and fix the issue, or at least better understand
the logic.
You can also watch the debug session as a youtube screencast.
Symbols
To enable examination of complex types and structs,
acid requires additional information.
For base 9front applications and commands this
information can easily be generated via the
mk target syms or by mk acme.acid:
 % cd /sys/src/cmd/acme
 % mk syms
6c -a acme.c > syms
for(i in ????.c) 6c -aa $i >> syms
 …
 % mk acme.acid
6c -FTVw acme.c
6c -FTVw -a acme.c >acme.acid
This generates complex type and structure definitions in the file
/sys/src/cmd/acme/(syms|acme.acid) for acid so
we can view any struct we like. Take a look at your compiler frontend
options (i.e. options -na in 2c(2)) that describe how to generate this information.
Start Acme
To run acme execute the following:
% window acme
…and determine its PID. This instance of acme will be the one we are
going to debug.
Attach Acid
To attach acid to the running
acme instance invoke:
 % acid -l /sys/src/cmd/acme/syms 117580
/proc/117580/text:amd64 plan 9 executable
/sys/lib/acid/port
/sys/lib/acid/amd64
acid:
At this point acid has attached to the program we are interested in and the debugging can start (NOTE the acid: prompt).
Set Breakpoints
At the acid: prompt we are going to set a breakpoint on the colgrow() function using the command bpset(colgrow):
acid: bpset(colgrow)
Waiting...
117580: system call	rendezvous+0xe	RET
acid:
Let’s make sure the breakpoint was set correctly by listing all set breakpoints using bptab():
acid: bptab()
	0x0000000000205944 colgrow  SUBQ	$0xa8,SP
To ensure the breakpoint is correct it helps to print the statement with some context source code around it (NOTE how the breakpoint address printed using bptab() is used as a parameter to src()):
acid: src(0x0000000000205944)
/sys/src/cmd/acme/cols.c:282
 277		free(c->w);
 278		c->w = wp;
 279	}
 280
 281	void
>282	colgrow(Column *c, Window *w, int but)
 283	{
 284		Rectangle r, cr;
 285		int i, j, k, l, y1, y2, *nl, *ny, tot, nnl, onl, dnl, h;
 286		Window *v;
 287
acid:
That looks Ok. Let’s cont()inue and actually trigger the breakpoint
by resizing a window in acme:
acid: cont()
117580: breakpoint	colgrow	SUBQ	$0xa8,SP
Let’s examine where in the source we are:
acid: src(*PC)
/sys/src/cmd/acme/cols.c:282
 277		free(c->w);
 278		c->w = wp;
 279	}
 280
 281	void
>282	colgrow(Column *c, Window *w, int but)
 283	{
 284		Rectangle r, cr;
 285		int i, j, k, l, y1, y2, *nl, *ny, tot, nnl, onl, dnl, h;
 286		Window *v;
 287
The breakpoint set to the function entry has triggered.
Step and Inspect
Great! We are where we are supposed to be. Now let’s step over a few
statements using next() and start examining some data structures:
acid: next()
117580: breakpoint	colgrow+0x7	MOVQ	w+0x8(FP),BX
117580: breakpoint	colgrow+0xf	MOVQ	BP,CX
117580: breakpoint	colgrow+0x12	XORL	DX,DX
/sys/src/cmd/acme/cols.c:288
 283	{
 284		Rectangle r, cr;
 285		int i, j, k, l, y1, y2, *nl, *ny, tot, nnl, onl, dnl, h;
 286		Window *v;
 287
>288		for(i=0; i<c->nw; i++)
 289			if(c->w[i] == w)
 290				goto Found;
 291		error("can't find window");
 292
 293	  Found:
acid: next()
...
acid: next()
117580: breakpoint	colgrow+0xcd4	JMP	colgrow+0x14(SB)
117580: breakpoint	colgrow+0x14	MOVQ	CX,c+0x0(FP)
117580: breakpoint	colgrow+0x1c	MOVL	0x150(CX),DI
117580: breakpoint	colgrow+0x22	CMPL	DI,DX
117580: breakpoint	colgrow+0x24	MOVL	DX,i+0x84(SP)
117580: breakpoint	colgrow+0x2b	JGE	colgrow+0xcd9(SB)
117580: breakpoint	colgrow+0x31	MOVLQSX	DX,DI
/sys/src/cmd/acme/cols.c:289
 284		Rectangle r, cr;
 285		int i, j, k, l, y1, y2, *nl, *ny, tot, nnl, onl, dnl, h;
 286		Window *v;
 287
 288		for(i=0; i<c->nw; i++)
>289			if(c->w[i] == w)
 290				goto Found;
 291		error("can't find window");
 292
 293	  Found:
 294		cr = c->r;
acid: next()
117580: breakpoint	colgrow+0x34	MOVQ	0x148(CX),SI
117580: breakpoint	colgrow+0x3b	MOVQ	0x0(SI)(DI*8),DI
117580: breakpoint	colgrow+0x3f	CMPQ	BX,DI
117580: breakpoint	colgrow+0x42	JNE	colgrow+0xcd2(SB)
117580: breakpoint	colgrow+0x48	MOVQ	0x0(CX),DI
/sys/src/cmd/acme/cols.c:294
 289			if(c->w[i] == w)
 290				goto Found;
 291		error("can't find window");
 292
 293	  Found:
>294		cr = c->r;
 295		if(but < 0){	/* make sure window fills its own space properly */
 296			r = w->r;
 297			if(i==c->nw-1 || c->safe==FALSE)
 298				r.max.y = cr.max.y;
 299			else
Although the acid function next() prints some context after stepping each stement, it would be good to see more. To quickly open the current location in an editor simply run:
acid: Bsrc(*PC)
Now let’s examine the variable cr. In our editor we see that cr is of type Rectangle. To explore the value of that structure we step using next() and then query the complex type Rectangle using (Rectangle)colgrow:cr:
acid: next()
117580: breakpoint	colgrow+0x4b	MOVQ	DI,cr+0x88(SP)
117580: breakpoint	colgrow+0x53	MOVQ	0x8(CX),DI
117580: breakpoint	colgrow+0x57	MOVQ	DI,0x90(SP)
117580: breakpoint	colgrow+0x5f	CMPL	but+0x10(FP),$0x0
/sys/src/cmd/acme/cols.c:295
 290				goto Found;
 291		error("can't find window");
 292
 293	  Found:
 294		cr = c->r;
>295		if(but < 0){	/* make sure window fills its own space properly */
 296			r = w->r;
 297			if(i==c->nw-1 || c->safe==FALSE)
 298				r.max.y = cr.max.y;
 299			else
 300				r.max.y = c->w[i+1]->r.min.y;
acid: (Rectangle)colgrow:cr
Point min {
	x	2807
	y	320
}
Point max {
	x	3114
	y	927
}
Note the reference to the variable cr is prefixed with the function name (i.e. its scope).
To understand what is going on towards the end of colgrow()
we set another breakpoint at the appropriate line of code and
cont() to that line (i.e. one can determine the current line via = in sam or Edit = in acme):
acid: bpset(filepc("/sys/src/cmd/acme/cols.c:430"))
acid: bptab()
	0x0000000000205944 colgrow  SUBQ	$0xa8,SP
	0x00000000002061c1 colgrow+0x87d  MOVQ	w+0x8(FP),SI
acid: cont()
117580: breakpoint	colgrow+0x87d	MOVQ	w+0x8(FP),SI
acid: src(*PC)
/sys/src/cmd/acme/cols.c:430
 425				r.max.y = r.min.y + Border;
 426				draw(screen, r, display->black, nil, ZP);
 427			}
 428			y1 = r.max.y;
 429		}
>430		r = w->r;
 431		r.min.y = y1;
 432		r.max.y = c->r.max.y;
 433		draw(screen, r, textcols[BACK], nil, ZP);
 434		free(nl);
 435		free(ny);
At this stage all that is left to do is to actually find the cause for the rendering issue and fix it, see:
Screencast
Here is the above debug session as a screencast on youtube to give you a better idea of how this works in action:
Summary
Acid is the Plan9 debugger. Once you wrap your head around its basic concepts debugging even complex applications such as acme is not difficult. The above is a simple debug session example and only scratches the surface of what one can do with acid. More advanced features are shown in Russ Cox presentation about acid.
Appendix
The following snippet is useful to have in an acme tag to enable faster
debugging via middle clicking and chording:
---
RUN: (acid -l ACIDFILE PID)
BRK: (bpset(FUNNAME)) | (bpset(filepc("src:line"))) | (bptab())
SRC: (Bsrc(*PC))      | (src(*PC))
STP: (cont())         | (next())                    | (run())
SEE: ((TYPE)FUN:VAR)  ((*FUN:VAR)\D)
---
The reason commands are wrapped in parentheses is to speed up selection by double clicking right after ( or before ).